
eZ Server Monitor (eSM) is a lightweight and simple dashboard for Linux machine. Two versions are available : a web and a shell version.
The features:
-
System
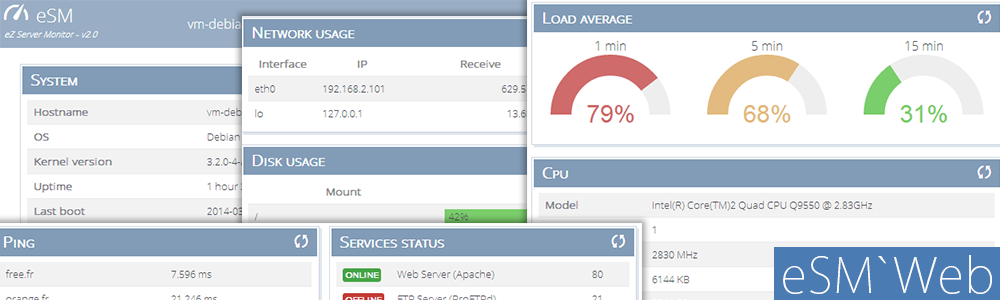
eZ Server Monitor Web – System
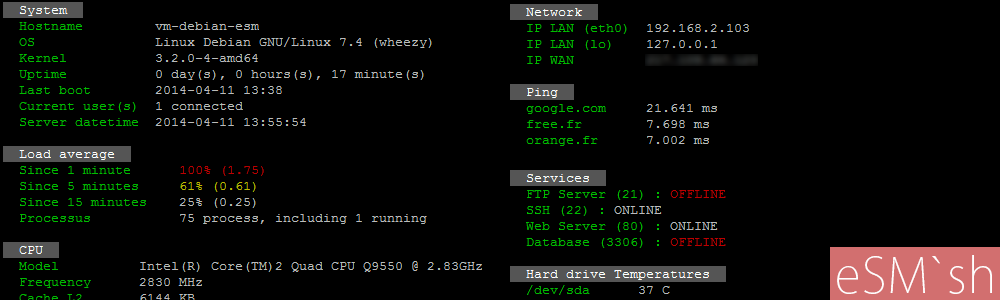
In System block, the datas about the computer are displayed :- hostname
- OS
- kernel version
- uptime
- last boot date
- number of current user(s)
- server datetime
-
Load Average
eZ Server Monitor Web – Load Average
Load average is displayed with gauges :
0 to 50% : green
51 to 75% : orange
76 to 100% : red -
CPU
eZ Server Monitor Web – CPU
CPU block contains several information about the CPU :
Model
Number of cores
CPU speed
Cache L2
Bogomips -
Network usage
eZ Server Monitor Web – Network usage
In Network usage block, the IP address and the received and transmitted data are displayed by interface -
Disk usage
eZ Server Monitor Web – Disk usage
Disk usage table’s represents each mount point with free space, used and total -
Memory information
eZ Server Monitor Web – Memory
Memory block contains used, free and total RAM -
Swap information
eZ Server Monitor Web – Swap
Swap block contains used, free and total Swap -
Last login
eZ Server Monitor Web – Last login
The last 5 connections are displayed in the Last login table -
Ping
eZ Server Monitor Web – Ping
eSM Web is able to ping hosts specified in configuration file -
Services
eZ Server Monitor Web – Services status
For each service defined in the configuration file, eSM`Web checks if is active (ONLINE) or not (OFFLINE)
My Powershell script categories
- Active Directory
- Cluster
- Database
- Exchange
- Files and folders
- Hardware
- Network
- Operating System
- PKI
- SCCM
- Service and process
- Tips
- VMWare