
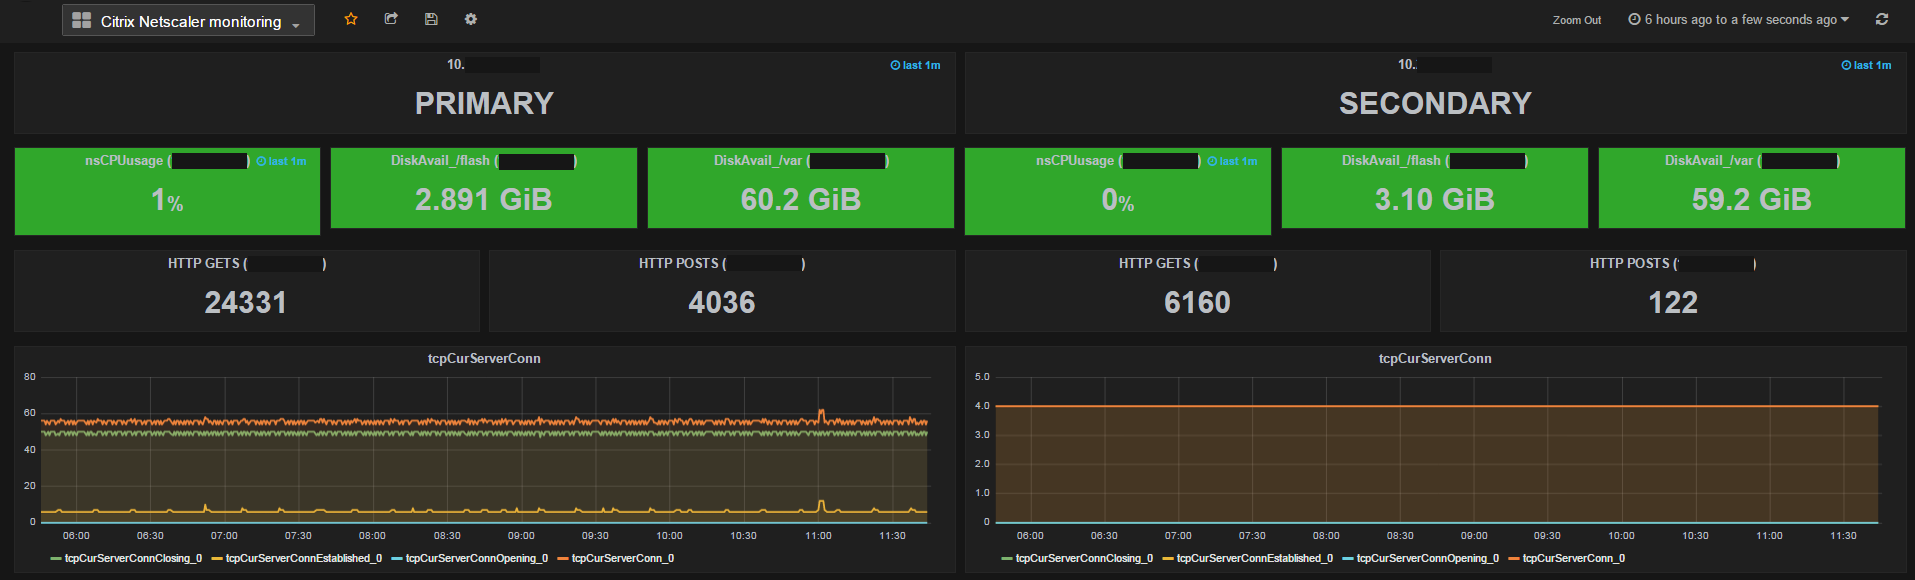
I have written a Python script to get information from a Citrix Netscaler appliance using SNMP and visualize them with Grafana. The SNMP data is retrieved with the snmpwalk tool.
The dashboard looks like this :
The software requirements are the following :
- a debian / ubuntu system (you can choose another os but prefer those ones if you need help :))
- influxdb database
- grafana
- python (for me I have the version 2.7.3)
- InfluxDBClient for python
Here we go…
You will have to perform some configurations on your Netscaler appliance :
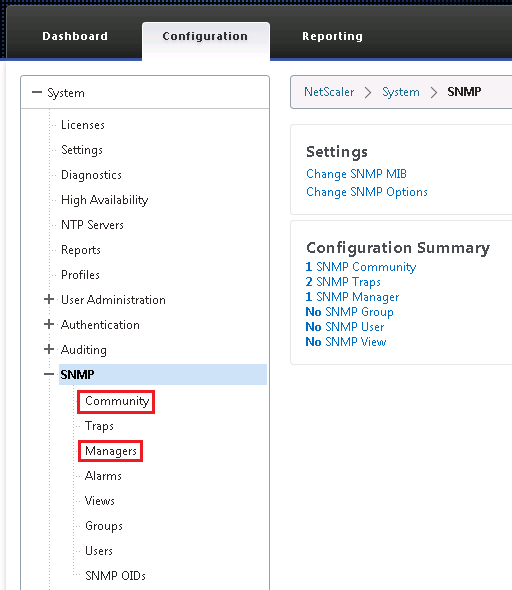
- Configuration tab > System > SNMP > Community > Add a new community “ctxmon” with permission “GET_NEXT”
- Configuration tab > System > SNMP > Managers > Add the IP address of the linux server where the snmpwalk command will run
Download the Netscaler MIB and install it on your linux server
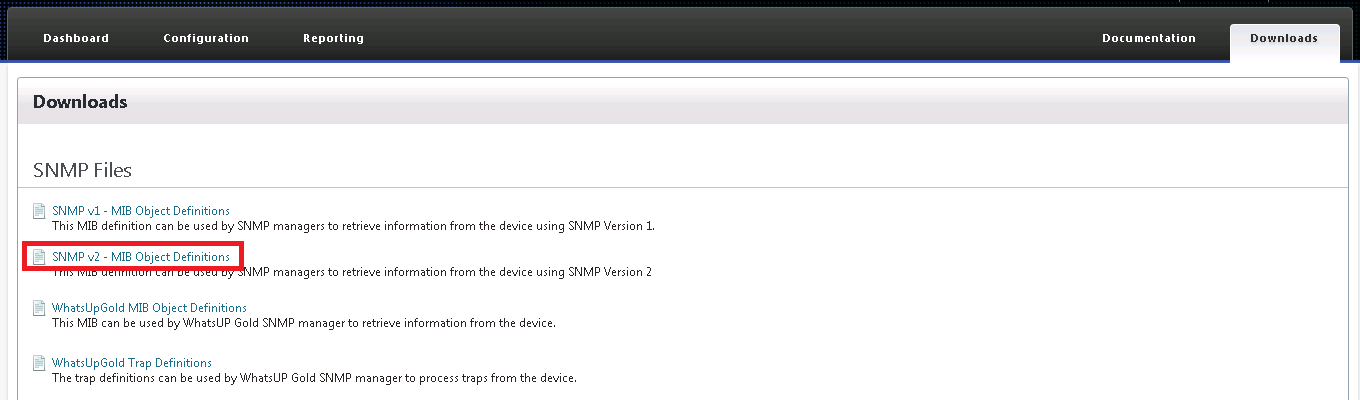
Copy the mib file to ~/.snmp/mibs/NS-ROOT-MIB
Edit the file ~/.snmp/snmp.conf
mibs +NS-ROOT-MIB
You can test if it works by launching the following command :
/usr/bin/snmpwalk -c ctxmon 10.11.0.100 -v2c 1.3.6.1.4.1.5951.4.1.1.41.8
And now the scripts :
#!/usr/bin/python

from __future__ import division
import socket
import ConfigParser
import os
import subprocess
from subprocess import call
import threading
import re
import time
from influxdb import InfluxDBClient

config = ConfigParser.RawConfigParser()
config.read(os.path.dirname(os.path.realpath(__file__))+'/config.ini')
snmpwalk = config.get('config', 'SNMPWALK')
snmpcommunity = config.get('config', 'COMMUNITY')
snmpmib = config.get('config', 'MIBNAME')
snmpversion = "-v2c"
dbsrvip = config.get('config', 'DBSRVIP')
dbsrvusr = config.get('config', 'DBSRVUSR')
dbsrvpwd= config.get('config', 'DBSRVPWD')
dbname= config.get('config', 'DBNAME')
netscaler_list = config.get('config', 'NETSCALER_IP')
sct = re.compile("^mon---", re.IGNORECASE)
client = InfluxDBClient(dbsrvip, 8096, dbsrvusr, dbsrvpwd, dbname)

monsct = filter(sct.search, config.sections())

threadLimiter = threading.BoundedSemaphore(value=200)

class myThread (threading.Thread):
    def __init__(self, threadID, name, snmpcmd, snmpmoninfo):
        threading.Thread.__init__(self)
        self.threadID = threadID
        self.name = name
        self.snmpcmd = snmpcmd
        self.snmpmoninfo = snmpmoninfo
    def run(self):
        threadLimiter.acquire()
        try:
                print_adrepl(self.name, self.snmpcmd, self.snmpmoninfo )
        finally:
                threadLimiter.release()

def print_adrepl(threadName, snmpcmd, snmpmoninfo):
        proc = subprocess.Popen(snmpcmd,stdout=subprocess.PIPE, stderr=subprocess.PIPE)
        outputlines = filter(lambda x:len(x)>0,(line.strip() for line in proc.stdout))
        for mon in outputlines:
                t = re.search(' = (.+?): ', mon)
                if t:
                        regexp = re.compile(r'[INTEGER|Gauge32|Counter64]')
                        if regexp.search(t.group(1)) is not None:
                                print t.group(1)
                                m = re.search('NS-ROOT-MIB::(.+?)\.', mon)
                                if m:
                                        monitor_name = m.group(1)
                                n = re.search('\.(.+?) = ', mon)
                                if n:
                                        monitor_component = n.group(1).replace('"',"")
                                monitor_value = mon.split(': ')[-1]
                                if re.search('[a-zA-Z]', monitor_value):
                                        v = re.search('\((.+?)\)', monitor_value)
                                        if v:
                                                monitor_value = v.group(1)
                                if (monitor_value).isdigit():
                                        timeserie = threadName + '.' + monitor_name + '_' + monitor_component
                                        json_body = [{
                                                        "points": [
                                                            [int(time.time()), int(monitor_value)]
                                                        ],
                                                        "name": timeserie,
                                                        "columns": ["time", "value"]
                                                    }]
                                        client.write_points(json_body, time_precision='s')
                                else:
                                        print threadName + '---' + monitor_name + monitor_component + monitor_value

threads = []

nslist = netscaler_list.split(' , ')

while 1:
        i = 1
        for nsip in nslist:
                for monitor in monsct :
                        snmpinfo = config.get(monitor, 'SNMPNAME')
                        snmpoid = config.get(monitor, 'SNMPOID')
                        snmpcmd = [snmpwalk , "-m" , snmpmib , "-c" , snmpcommunity , nsip , snmpversion , snmpoid ]
                        thread = myThread(i, str(nsip), snmpcmd, snmpinfo )
                        thread.start()
                        threads.append(thread)
                        i += 1
        time.sleep(30)

        for t in threads:
                t.join()
        print "Exiting Main Thread"
[config]
SNMPWALK=/usr/bin/snmpwalk
COMMUNITY=ctxmon
MIBNAME=NS-ROOT-MIB
NETSCALER_IP=10.11.0.100 , 10.11.0.200

[mon---1]
SNMPNAME=nsCPUusage
SNMPOID=1.3.6.1.4.1.5951.4.1.1.41.6.1.2

[mon---2]
SNMPNAME=nsSysHealthDiskTable
SNMPOID=1.3.6.1.4.1.5951.4.1.1.41.8

[mon---3]
SNMPNAME=nsTcpStatsGroup
SNMPOID=1.3.6.1.4.1.5951.4.1.1.46

[mon---4]
SNMPNAME=nsHttpStatsGroup
SNMPOID=1.3.6.1.4.1.5951.4.1.1.48

[mon---5]
SNMPNAME=nsAaaStatsGroup
SNMPOID=1.3.6.1.4.1.5951.4.1.1.67

[mon---6]
SNMPNAME=vserverTable
SNMPOID=1.3.6.1.4.1.5951.4.1.3.1

[mon---7]
SNMPNAME=sysHighAvailabilityMode
SNMPOID=1.3.6.1.4.1.5951.4.1.1.6
Do not hesitate to leave a message if you have a question or a problem to make it work !
My Powershell script categories
- Active Directory
- Cluster
- Database
- Exchange
- Files and folders
- Hardware
- Network
- Operating System
- PKI
- SCCM
- Service and process
- Tips
- VMWare
Hi,
I am trying this script. It is’t working.
Could u help to me ?
raceback (most recent call last):
File “nsdashboard.py”, line 16, in
snmpwalk = config.get(‘config’, ‘SNMPWALK’)
File “/usr/lib/python2.7/ConfigParser.py”, line 330, in get
raise NoSectionError(section)
ConfigParser.NoSectionError: No section: ‘config’