
This solution will help you to track Active Directory failed authentication requests. It is based on two “modules” :
- Task scheduled triggered by event ID
- Splunk for visualization
Splunk
The first step is to have a running Splunk system. You can there to download it.
Index
Create your first Splunk index :
1. In Splunk Web, navigate to Settings > Indexes and click New.
2. To create a new index, enter:
- A name for the index. User-defined index names must consist of only numbers, lowercase letters, underscores, and hyphens. They cannot begin with an underscore or hyphen, or contain the word “kvstore”.
- The path locations for index data storage:
- Home path; leave blank for default
$SPLUNK_DB/<index_name>/db - Cold db path; leave blank for default
$SPLUNK_DB/<index_name>/colddb - Thawed/resurrected db path, leave blank for default
$SPLUNK_DB/<index_name>/thaweddb
- Home path; leave blank for default
- The maximum size of the entire index. Defaults to 500000MB.
- The maximum size of the hot (currently written to) portion of this index. When setting the maximum size, you should use
auto_high_volumefor high volume indexes (such as the main index); otherwise, useauto. - The frozen archive path. Set this field if you want to archive frozen buckets. For information on bucket archiving, see “Archive indexed data”.
Note: For detailed information on each of these settings, see “Configure index storage”.
3. Click Save.
You can edit an index by clicking on the index name in the Indexes section of the Settings menu in Splunk Web. Properties that you cannot change in Splunk Web are grayed out. To change those properties, edit indexes.conf, then restart the indexer.
Note: Some index properties are configurable only by editing the indexes.conf file. Check the indexes.conftopic for a complete list of properties.
Inputs
You can add data inputs from Splunk Home or Splunk System:
From Splunk Home, select Add Data. This takes you to the Add Data page, with links to recipes for a wide variety of data input types. This is the easiest way to start adding inputs. See “How do you want to add data?”
From anywhere in Splunk Web, select System. Then select Data inputs from the Data section of the System pop-up. This takes you to a page where you can view and manage your existing inputs, as well as add new ones.
The Add Data page offers three options to get data in: Upload, Monitor, and Forward. Clicking one of the icons takes you to a page that lets you define the data you want to upload, monitor, or forward.
For more information on using Splunk Web to configure your inputs, look in the topics covering specific inputs later in this manual. For example, to learn how to use Splunk Web to configure network inputs, see “Get data from TCP and UDP ports.”
You can configure most inputs with Splunk Web. For a small number of input types, you must edit inputs.conf directly. In addition, some advanced settings for other input types are available only through inputs.conf.
When you add an input through Splunk Web, Splunk Enterprise adds that input to a copy of inputs.conf that belongs to the app you’re currently in. This has consequences that you need to consider. For example, if you navigated to Splunk System directly from the Search page and then added an input there, Splunk Enterprise adds the input to $SPLUNK_HOME/etc/apps/search/local/inputs.conf. Make sure you’re in the desired app when you add your inputs. For background on how configuration files work, read “About configuration files”.
For this example we will use the following values :
[udp://11111]
connection_host = ip
index = ad-auth
source = ad-auth
sourcetype = syslog
Normally you can now go to the next step (I’m not a Splunk specialist, only a poor user 🙂 )
Windows Tasks
Auditing Policies
On the domain controllers you want to audit, be sure you have enabled these audit policies :
Audit account logon events
Audit logon events
Scheduled Tasks (triggered by Events)
Create the first task scheduled as described below :
- copy the script below in c:\temp on the domain controller
- create a scheduled task with this parameters :
- name : event 4625
- Trigger type : “On an event”
- Trigger Settings : “Custom” > click on the button “New Event Filter” :
Logs : Security
Source : Microsoft Windows security auditing.
Event ID : 4625 - click on the ok button to close the “New Event Filter” window
- Action tab : Click “New” > Program/script = powershell.exe
Argument = -executionpolicy bypass “c:\temp\event4625.ps1” -eventIpPort $(eventIpPort) -eventIpAddress $(eventIpAddress) -eventProcessName $(eventProcessName) -eventWorkstationName $(eventWorkstationName) -eventLogonType $(eventLogonType) -eventSubStatus $(eventSubStatus) -eventStatus $(eventStatus) -eventTargetDomainName $(eventTargetDomainName) -eventTargetUserName $(eventTargetUserName) -eventTargetUserSid $(eventTargetUserSid) -eventSubjectUserSid $(eventSubjectUserSid) -eventSubjectUserName $(eventSubjectUserName) -eventSubjectDomainName $(eventSubjectDomainName)
Start in = c:\temp
- Close the windows to validate the creation of the scheduled task
- Right click the scheduled task > Export
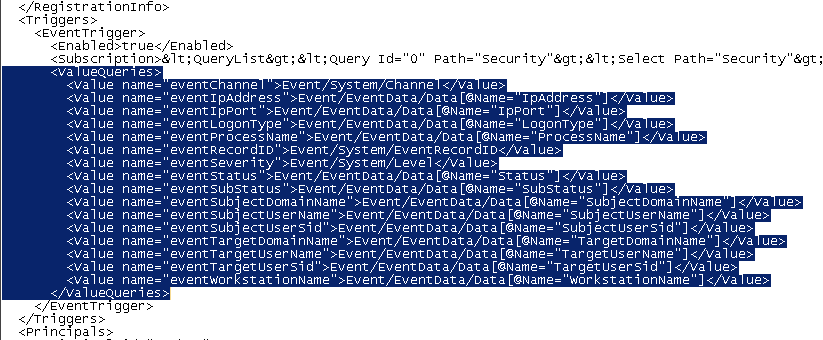
- open the exported file with a text editor
- add the following lines :
<ValueQueries> <Value name="eventChannel">Event/System/Channel</Value> <Value name="eventIpAddress">Event/EventData/Data[@Name="IpAddress"]</Value> <Value name="eventIpPort">Event/EventData/Data[@Name="IpPort"]</Value> <Value name="eventLogonType">Event/EventData/Data[@Name="LogonType"]</Value> <Value name="eventProcessName">Event/EventData/Data[@Name="ProcessName"]</Value> <Value name="eventRecordID">Event/System/EventRecordID</Value> <Value name="eventSeverity">Event/System/Level</Value> <Value name="eventStatus">Event/EventData/Data[@Name="Status"]</Value> <Value name="eventSubStatus">Event/EventData/Data[@Name="SubStatus"]</Value> <Value name="eventSubjectDomainName">Event/EventData/Data[@Name="SubjectDomainName"]</Value> <Value name="eventSubjectUserName">Event/EventData/Data[@Name="SubjectUserName"]</Value> <Value name="eventSubjectUserSid">Event/EventData/Data[@Name="SubjectUserSid"]</Value> <Value name="eventTargetDomainName">Event/EventData/Data[@Name="TargetDomainName"]</Value> <Value name="eventTargetUserName">Event/EventData/Data[@Name="TargetUserName"]</Value> <Value name="eventTargetUserSid">Event/EventData/Data[@Name="TargetUserSid"]</Value> <Value name="eventWorkstationName">Event/EventData/Data[@Name="WorkstationName"]</Value> </ValueQueries> - save and close the file
- delete the scheduled task you have created previously
- right click and then import the modified xml file as a new scheduled task
event4625.ps1 (required libraries)
param(
    $eventSubjectUserSid,
    $eventSubjectUserName,
    $eventSubjectDomainName,
    $eventTargetUserSid,
    $eventTargetUserName,
    $eventTargetDomainName,
    $eventStatus,
    $eventSubStatus,
    $eventLogonType,
    $eventWorkstationName,
    $eventProcessName,
    $eventIpAddress,
    $eventIpPort
    )

Set-StrictMode -version 2.0

# Store script execution pass (to find libraries)
$strExecutionPath = Split-Path -Path $MyInvocation.MyCommand.Definition -Parent
# Include our syslog library
. ($strExecutionPath + '.\syslog.ps1')
# Include our debug library
. ($strExecutionPath + '.\debug.ps1')

# ========== Configuration starts here =============
# Splunk host / port definition
$strSplunkHost = "your-splunk-server-hostname"
$iSplunkPort = 11111
# Display debug messages
$global:iDebug = 0
# Display debug messages in Send2Syslog library
$global:iSyslogDebug = 0

# ========== Configuration ends here =============

## splunk var info
# i	> Event ID
# u	> Username (target)
# su	> Username (source)
# s 	> User SID (target)
# ss	> User SID (source)
# fi	> IP Address (from)
# fn	> Hostname (from)
# sn	> Service Name
# p	> Process Name
# l	> Logon type
# sc	> Status code
# sb	> Substatus code

$strMsg = "i=4625 ss=$eventSubjectUserSid su=$eventSubjectUserName s=$eventTargetUserSid u=$eventTargetUserName sc=0x" + $eventStatus.ToString('X2') +" sb=0x" + $eventSubStatus.ToString('X2') +" l=$eventLogonType fn=$eventWorkstationName fi=$eventIpAddress p=$eventProcessName"
Send2Syslog $strSplunkHost $iSplunkPort $strMsg "user" "info"
Create the second task scheduled as described below :
- copy the script below in c:\temp on the domain controller
- create a scheduled task with this parameters :
- name : event 4771
- Trigger type : “On an event”
- Trigger Settings : “Custom” > click on the button “New Event Filter” :
Logs : Security
Source : Microsoft Windows security auditing.
Event ID : 4771 - click on the ok button to close the “New Event Filter” window
- Action tab : Click “New” > Program/script = powershell.exe
Argument = -executionpolicy bypass “c:\temp\event4771.ps1” -eventIpPort $(eventIpPort) -eventIpAddress $(eventIpAddress) -eventStatus $(eventStatus) -eventTargetUserName $(eventTargetUserName) -eventTargetUserSid $(eventTargetUserSid) -eventServiceName $(eventServiceName) -eventTicketOptions $(eventTicketOptions) -eventPreAuthType $(eventPreAuthType) -eventCertIssuerName $(eventCertIssuerName) -eventCertSerialNumber $(eventCertSerialNumber) -eventCertThumbprint $(eventCertThumbprint)
Start in = c:\temp
- Close the windows to validate the creation of the scheduled task
- Right click the scheduled task > Export
- open the exported file with a text editor
- add the following lines :
<ValueQueries> <Value name="eventCertIssuerName">Event/EventData/Data[@Name="CertIssuerName"]</Value> <Value name="eventCertSerialNumber">Event/EventData/Data[@Name="CertSerialNumber"]</Value> <Value name="eventCertThumbprint">Event/EventData/Data[@Name="CertThumbprint"]</Value> <Value name="eventChannel">Event/System/Channel</Value> <Value name="eventIpAddress">Event/EventData/Data[@Name="IpAddress"]</Value> <Value name="eventIpPort">Event/EventData/Data[@Name="IpPort"]</Value> <Value name="eventPreAuthType">Event/EventData/Data[@Name="PreAuthType"]</Value> <Value name="eventRecordID">Event/System/EventRecordID</Value> <Value name="eventServiceName">Event/EventData/Data[@Name="ServiceName"]</Value> <Value name="eventSeverity">Event/System/Level</Value> <Value name="eventStatus">Event/EventData/Data[@Name="Status"]</Value> <Value name="eventTargetUserName">Event/EventData/Data[@Name="TargetUserName"]</Value> <Value name="eventTargetUserSid">Event/EventData/Data[@Name="TargetSid"]</Value> <Value name="eventTicketOptions">Event/EventData/Data[@Name="TicketOptions"]</Value> </ValueQueries> - save and close the file
- delete the scheduled task you have created previously
- right click and then import the modified xml file as a new scheduled task
event4771.ps1 (required libraries)
param(
    $eventIpPort,
    $eventIpAddress,
    $eventStatus,
    $eventTargetUserName,
    $eventTargetUserSid,
    $eventServiceName,
    $eventTicketOptions,
    $eventPreAuthType
    )

Set-StrictMode -version 2.0

# Store script execution pass (to find libraries)
$strExecutionPath = Split-Path -Path $MyInvocation.MyCommand.Definition -Parent
# Include our syslog library
. ($strExecutionPath + '.\syslog.ps1')
# Include our debug library
. ($strExecutionPath + '.\debug.ps1')

# ========== Configuration starts here =============
# Splunk host / port definition
$strSplunkHost = "your-splunk-server-hostname"
$iSplunkPort = 11111
# Display debug messages
$global:iDebug = 0
# Display debug messages in Send2Syslog library
$global:iSyslogDebug = 0

# ========== Configuration ends here =============

## splunk var info
# i	> Event ID
# u	> Username (target)
# su	> Username (source)
# s 	> User SID (target)
# ss	> User SID (source)
# fi	> IP Address (from)
# fn	> Hostname (from)
# sn	> Service Name
# p	> Process Name
# l	> Logon type
# sc	> Status code
# sb	> Substatus code

$strMsg = "i=4771 u=$eventTargetUserName s=$eventTargetUserSid f=$eventIpAddress sn=$eventServiceName sc=0x" + $eventStatus.ToString('X2')
Send2Syslog $strSplunkHost $iSplunkPort $strMsg "user" "info"
Visualize
Normally you can now view events in the Splunk index you have created : go to the Splunk search page (App: Search & Reporting)
In the search field, enter : index=”ad-auth”
You will have all the events forwarded to the Splunk server.
You can go further and create a new dashboard using the data :
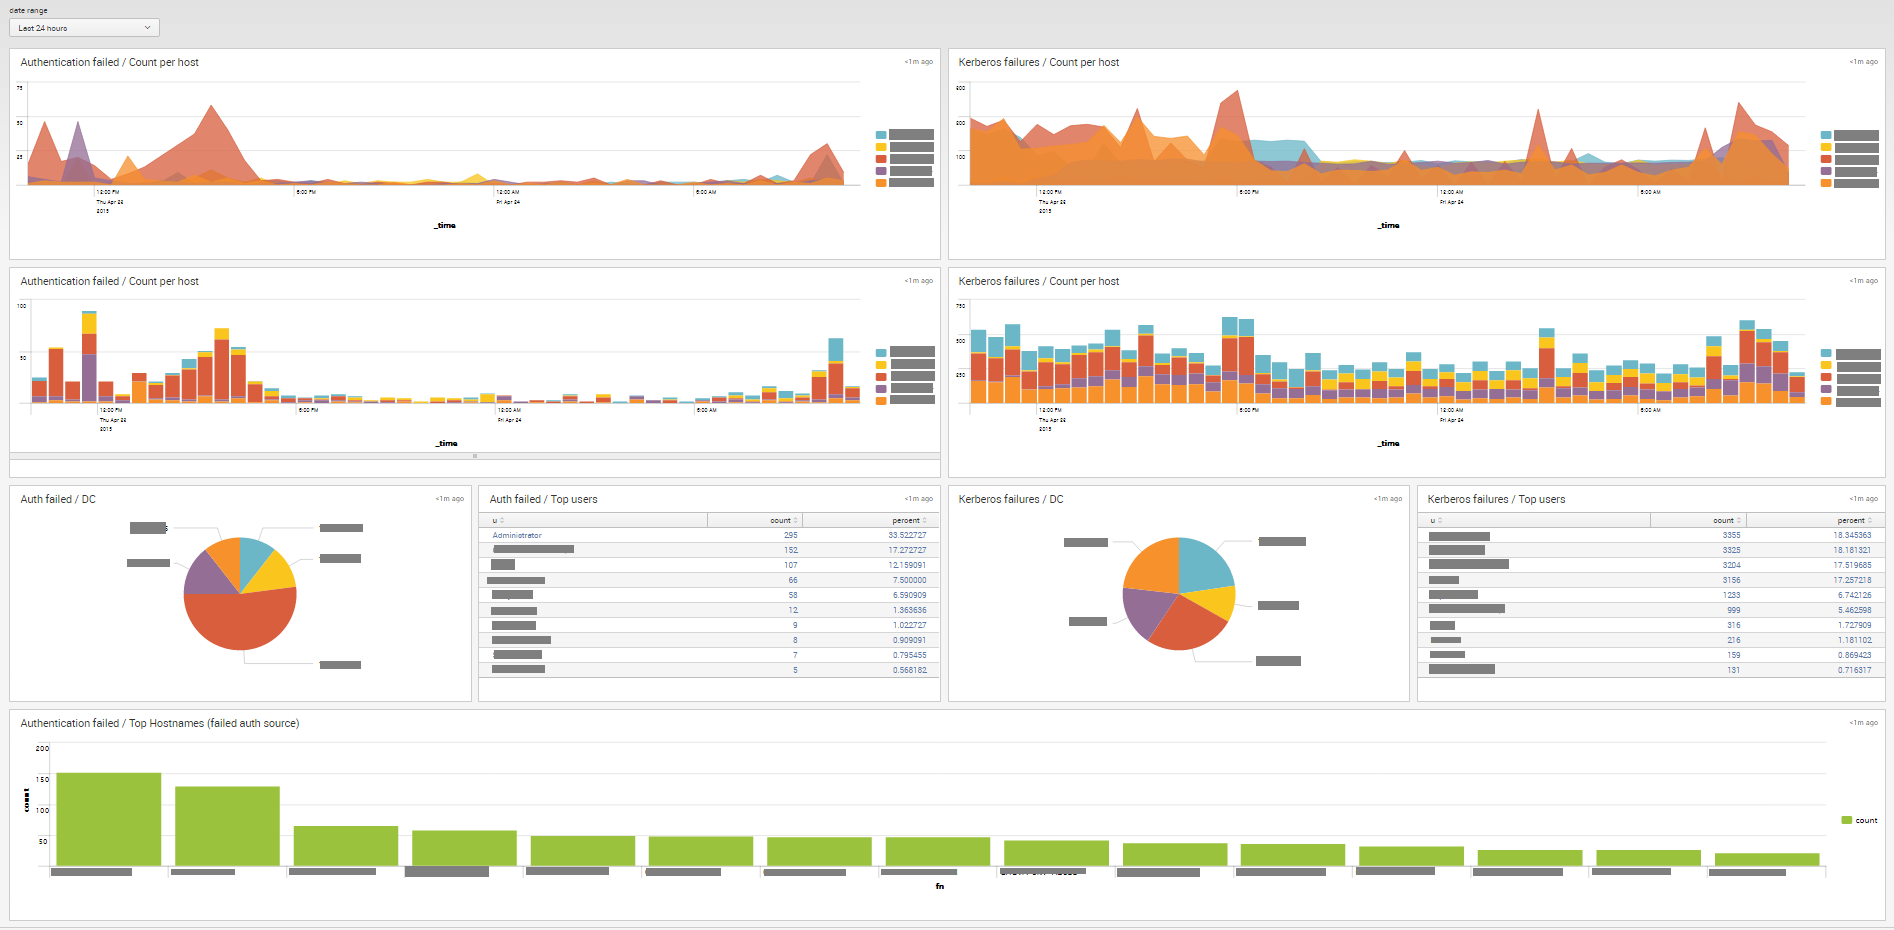
References
http://docs.splunk.com/Documentation/Splunk/6.2.2/Indexer/Setupmultipleindexes
http://docs.splunk.com/Documentation/Splunk/6.2.2/Data/Configureyourinputs
My Powershell script categories
- Active Directory
- Cluster
- Database
- Exchange
- Files and folders
- Hardware
- Network
- Operating System
- PKI
- SCCM
- Service and process
- Tips
- VMWare