
The purpose of this tutorial is to help you to configure the following components :
- bind : configure statistics
- influxdb : time series database
- collectd-proxy : program written in Go that will act as a gateway between collectd and influxdb
- collectd : collect Bind statistics
- grafana : create your graph with grafana using the data stored in the influxdb database
In this tutorial, I will use :
- 2 Bind servers (master/slave) : dns01 and dns02
- 1 monitoring machine running on Debian : mon01
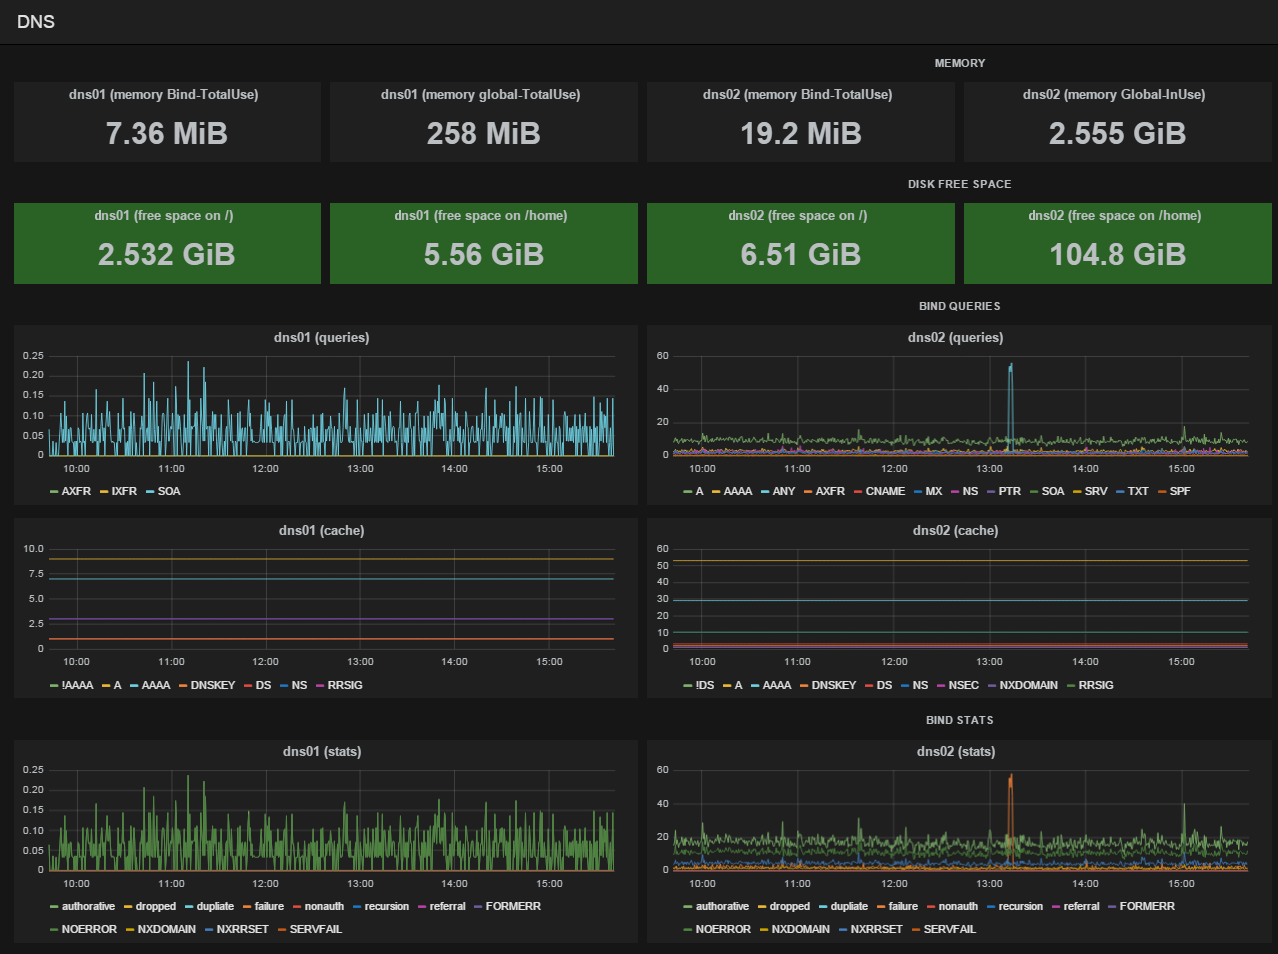
At the end, you will be able to create dashboards like this :
First step : Configure Bind statistics on dns01 and dns02
To configure statistics on Bind, you have to edit two files and add the following lines :
– /etc/bind/named.conf :
statistics-channels {
     inet * port 7766 allow { localhost; };
};
– /etc/bind/named.conf.options :
options {
...
        statistics-file "/var/log/bind/named.stats";
        zone-statistics yes ;
...
}
Restart Bind
service bind9 restart
Repeat these steps on all of your Bind servers. You can test everything is ok, by running locally on the bind server, the following command :
curl http://localhost:7766
Install and configure influxdb on mon01
# for 64-bit systems
wget http://s3.amazonaws.com/influxdb/influxdb_latest_amd64.deb
sudo dpkg -i influxdb_latest_amd64.deb

# for 32-bit systems
wget http://s3.amazonaws.com/influxdb/influxdb_latest_i386.deb
sudo dpkg -i influxdb_latest_i386.deb
Then start the daemon by running:
sudo /etc/init.d/influxdb start
Edit the configuration file /opt/influxdb/shared/config.toml and the following variables are set properly :
...
bind-address = "0.0.0.0"

[admin]
port   = 8083              # binding is disabled if the port isn't set

[api]
port     = 8096
...
Restart the influxdb service
service influxdb restart
Create the databases for both dns01 and dns02 with the following commands :
curl -X POST 'http://localhost:8096/db?u=root&p=root' -d '{"name": "dns01_collectd"}'
curl -X POST 'http://localhost:8096/db?u=root&p=root' -d '{"name": "dns02_collectd"}'
Install and configure the collectd-proxy
Ensure that you have an up-to-date Go library before typing the following commands:
git clone https://github.com/hoonmin/influxdb-collectd-proxy.git
cd influxdb-collectd-proxy
make
On dns01
./proxy –influxdb=mon01:8096 –typesdb=/usr/share/collectd/types.db –database=dns01_collectd –username=root –password=root -proxyport=8899
On dns02
./proxy –influxdb=mon01:8096 –typesdb=/usr/share/collectd/types.db –database=dns02_collectd –username=root –password=root -proxyport=8899
Install and configure collectd
Command to install:
apt-get install collectd
Edit the file /etc/collectd/collectd.conf and add the following lines :
LoadPlugin bind
LoadPlugin network
<Plugin "bind">
        URL "http://localhost:7766/"
        ParseTime false
        OpCodes true
        QTypes true
        ServerStats true
        ZoneMaintStats true
        ResolverStats false
        MemoryStats true
        <View "_default">
                QTypes true
                ResolverStats true
                CacheRRSets true
        </View>
</Plugin>
<Plugin network>
        Server "localhost" "8899"
</Plugin>
Reload collectd:
service collectd reload
Grafana
Download the latest release here
wget http://grafanarel.s3.amazonaws.com/grafana-1.9.1.tar.gz
Unzip the archive and copy the folder to the root of the web server mon01:
tar -zxvf grafana-1.9.1.tar.gz
cp -R grafana /var/www/
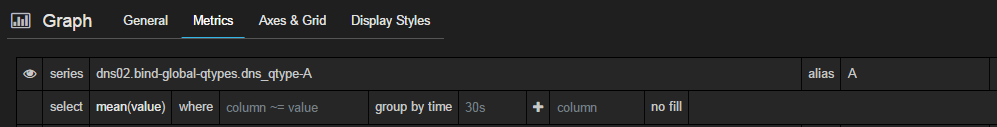
Create your first graph
Example query to graph the number of request on the host A records
You can adapt the following json file to create the dashboard described in this procedure
Go further
You can now go further with collectd and grafana by enabling other collectors like for example :
- LoadPlugin cpu
- LoadPlugin df
- LoadPlugin disk
- LoadPlugin entropy
- LoadPlugin interface
- LoadPlugin irq
- LoadPlugin load
- LoadPlugin memory
- LoadPlugin processes
- LoadPlugin swap
- LoadPlugin users
You can find the whole list here
Do not hesitate to leave a comment if you see any errors in this doc or if you have any questions.
My Powershell script categories
- Active Directory
- Cluster
- Database
- Exchange
- Files and folders
- Hardware
- Network
- Operating System
- PKI
- SCCM
- Service and process
- Tips
- VMWare
Reference
Monitor metrics collected by collectd into InfluxDB
Hello, this command not work for me :
git clone https://github.com/hoonmin/influxdb-collectd-proxy.git
root@Zabbix:/etc/bind# git clone https://github.com/hoonmin/influxdb-collectd-proxy.git
Cloning into ‘influxdb-collectd-proxy’…
error: gnutls_handshake() failed: A TLS packet with unexpected length was received. while accessing https://github.com/hoonmin/influxdb-collectd-proxy.git/info/refs
fatal: HTTP request failed
help me plz
Hello Revelon,
The error source is probably your environment (proxy,…). I have found an interresting article that can be used to solve your problem : http://stackoverflow.com/questions/13524242/error-gnutls-handshake-failed-git-repository
Why the query stats are floating not interger?
Why the query stats are floating not interger?