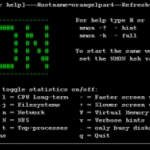
pyNmonAnalyzer is a tool for parsing and reshuffeling nmon’s output into “normal” csv format. Nmon puts out a long file with a system-info header at the beginning, followed by a continuous stream of time stamped readings. This format makes it difficult for analysis by standard Spreadsheet viewers without a fair amount of preprocessing. The pyNmonAnalyzer aims to make this simpler, faster and more effective. In one sweep the pyNmonAnalyzer creates CSV files and two HTML-based reports, one with static graphs and one with interactive graphs powered by dygraphs. This project is currently a work-in-progress and therefore will hopefully improve in functionality and usability. If you have questions, find a bug or have feature requests, please do file an issues here
I have created these graphs with data retrieved from a raspberry Pi with Nmon:
To install properly pyNmonAnalyzer, follow these steps :
> pip install pyNmonAnalyzer
> apt-get install python-numpy python-matplotlib
Usage
usage: pyNmonAnalyzer [-h] [-x] [-d] [--force] [-i INPUT_FILE] [-o OUTDIR]
                      [-c] [-b] [-t REPORTTYPE] [-r CONFFNAME]
                      [--dygraphLocation DYGRAPHLOC] [--defaultConfig]
                      [-l LOGLEVEL]

nmonParser converts NMON monitor files into time-sorted CSV/Spreadsheets for
easier analysis, without the use of the MS Excel Macro. Also included is an
option to build an HTML report with graphs, which is configured through
report.config.

optional arguments:
  -h, --help            show this help message and exit
  -x, --overwrite       overwrite existing results (Default: False)
  -d, --debug           debug? (Default: False)
  --force               force using of config (Default: False)
  -i INPUT_FILE, --inputfile INPUT_FILE
                        Input NMON file
  -o OUTDIR, --output OUTDIR
                        Output dir for CSV (Default: ./report/)
  -c, --csv             CSV output? (Default: False)
  -b, --buildReport     report output? (Default: False)
  -t REPORTTYPE, --reportType REPORTTYPE
                        Should we be generating a "static" or "interactive"
                        report (Default: interactive)
  -r CONFFNAME, --reportConfig CONFFNAME
                        Report config file, if none exists: we will write the
                        default config file out (Default: ./report.config)
  --dygraphLocation DYGRAPHLOC
                        Specify local or remote location of dygraphs library.
                        This only applies to the interactive report. (Default:
                        http://dygraphs.com/dygraph-dev.js)
  --defaultConfig       Write out a default config file
  -l LOGLEVEL, --log LOGLEVEL
                        Logging verbosity, use DEBUG for more output and
                        showing graphs (Default: INFO)
My Powershell script categories
- Active Directory
- Cluster
- Database
- Exchange
- Files and folders
- Hardware
- Network
- Operating System
- PKI
- SCCM
- Service and process
- Tips
- VMWare

Flexible — 13 switches instead of 2 or 3, for what I expect, producing csv or html. But then someone (me) spends 15 minutes on unsucessful trying to figure out how to output html. Hurts a minimalist like me.